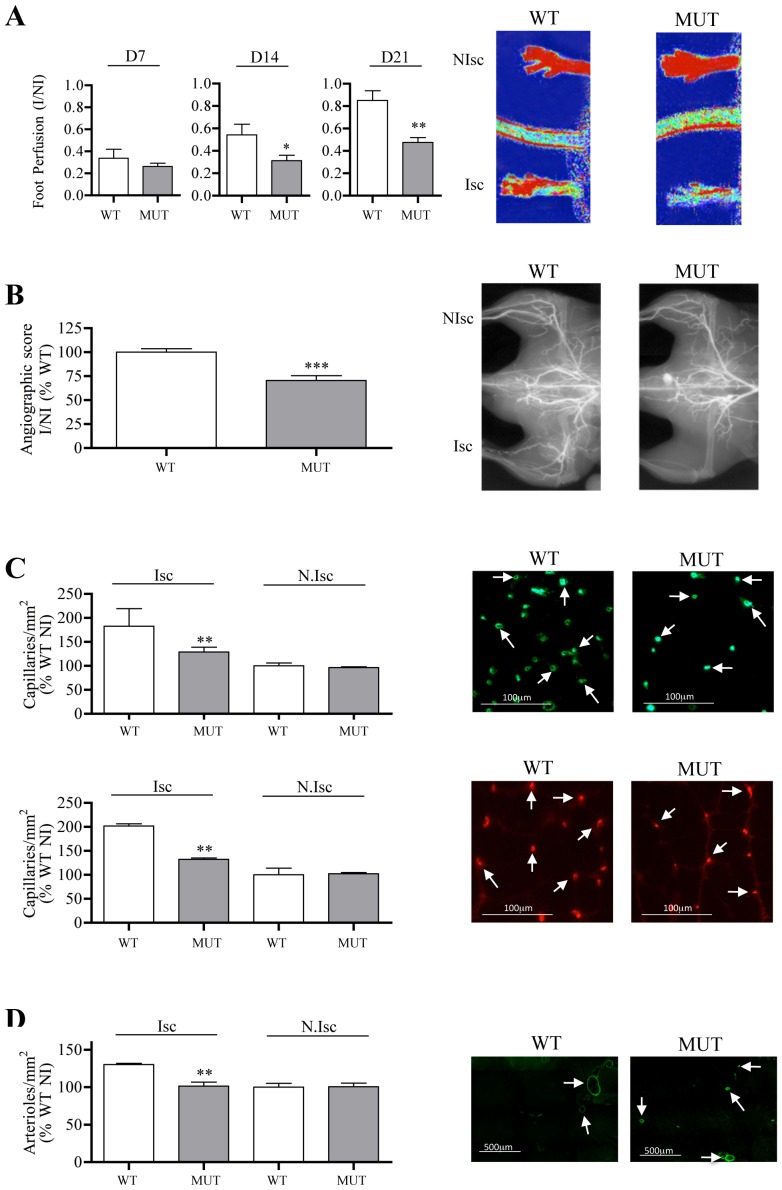
Figure 3. Postischemic revascularization in Cxcl12Gagtm/Gagtm animals.
Quantitative evaluation and representative photomicrographs of foot perfusion at different time points (A), and at day 21, for angiographic score (B, vessels in white), capillary density (C, capillaries in green, arrows show fibronectin–labelled capillaries), arteriole density (D, arterioles in green, arrows show α-actin –labelled arterioles) in Cxcl12Gagtm/Gagtm (MUT) and wild-type littermate (WT) animals. Results are shown in ischemic (Isc) and non-ischemic (N.Isc) legs. D indicates day. Values are mean ± SEM. n = 15 per group, representative of 3 independent experiments. A) 15 possible comparisons for Bonferroni correction, a value of p<0.003 was considered significant, *p<0.03 and **p<0.0006 versus WT. B) 1 possible comparisons for Bonferroni correction, a value of p<0.05 was considered significant, ***p<0.001 versus WT. n = 15 per group. C–D) 6 possible comparisons for Bonferroni correction, a value of p<0.008 was considered significant, **p<0.0016 versus Isc WT. n = 15 per group.

