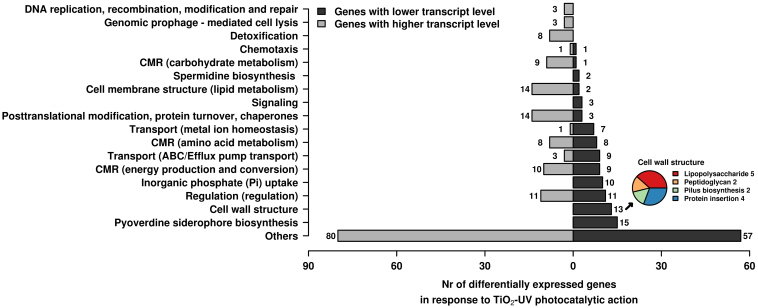
Figure 3. Distribution by function of genes expressed at higher (light grey colour) and lower (dark grey colour) transcript level in response to low doses of TiO2-UV treatment compared to the control (UV + EVOH) condition.
The number of genes assigned to each category was calculated on the basis of the gene expression levels specifically shown in Supplementary Table S2. Abbreviation as follows: CMR, central metabolic reactions. For the cell wall biogenesis pathway, the number of under-expressed genes encoding proteins involved in lipopolysaccharide and peptidoglycan metabolisms, pilus biosynthesis and protein insertion are specifically shown (inset at the right down corner).

