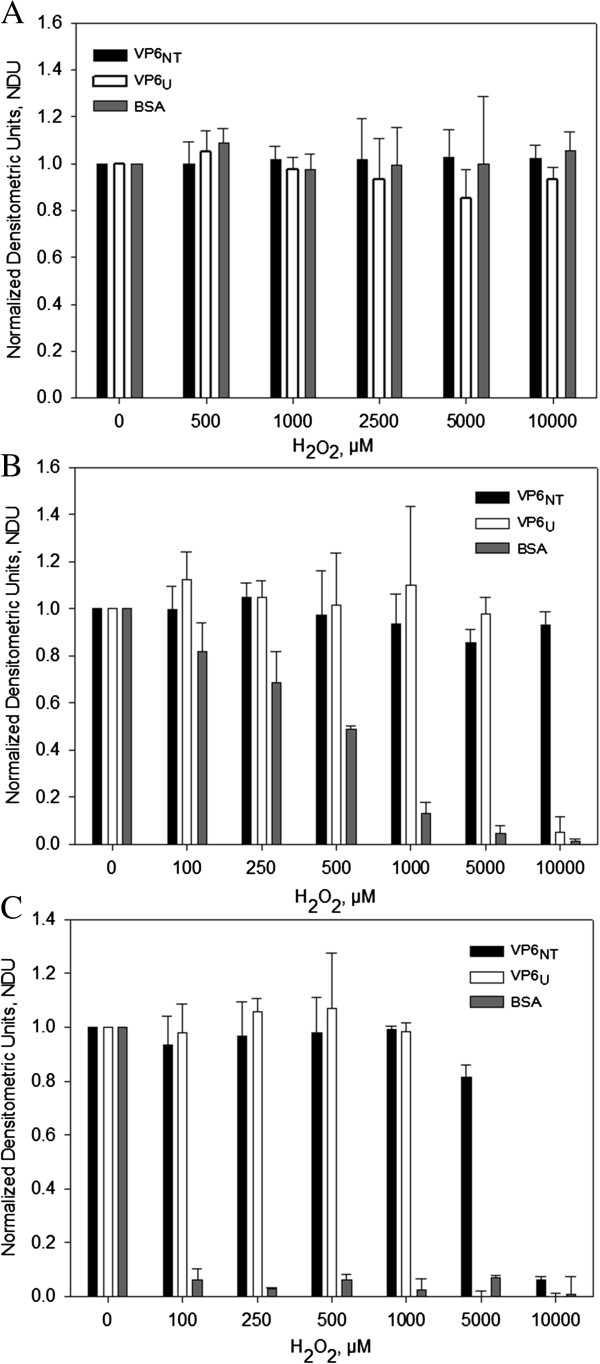
Figure 2.

Densitometric analysis of reducing 12% SDS-PAGE gels loaded with 2.5 µg of VP6NT, VP6U and BSA previously exposed to different oxidative treatments and stained with Coomassie blue. A) Exposure of protein samples to different concentrations of H2O2 for 6 h. B) Exposure of protein samples to metal catalyzed oxidation (MCO) with 150 µM of FeCl2 at various H2O2 concentrations for 1 h. C) Exposure of protein samples to MCO with 150 µM of FeCl2 at various H2O2 concentrations for 6 h. Measurements were performed to identically treated samples from triplicate experiments. Error bars represent standard deviations among experiments.
