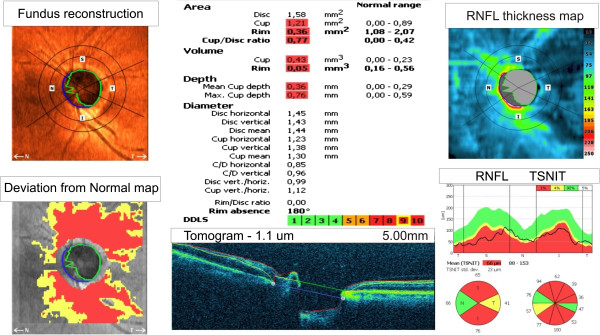
Figure 2.

The result for one patient obtained from the Copernicus tomograph. The following images can be seen in the corners: fundus reconstruction, a deviation from the normal map, the RNFL thickness map and the graph RNFL TSNIT. In the central part at the bottom there is a sample B-scan of the optic disk. The central part is dedicated to the ratios calculated by the software.
