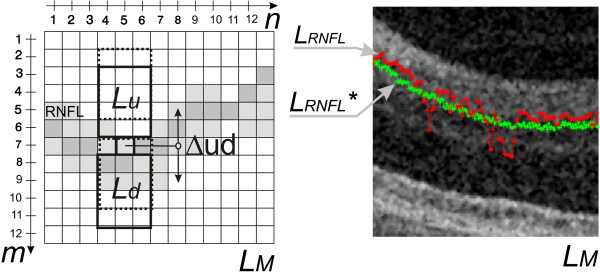
Figure 6.

The results of the dynamic adjustment of the contour position. On the left side, the idea of the dynamic contour position adjustment has been shown. The difference between the mean values in the areas Lu and Ld provides information about the correct position of the point. The greatest difference between the areas Lu and Ld is searched for in a selected area. The right side shows an example of the input waveform of LRNFL(n,i) in red and the result of the position adjustment of LRNFL*(n,i) in green.
