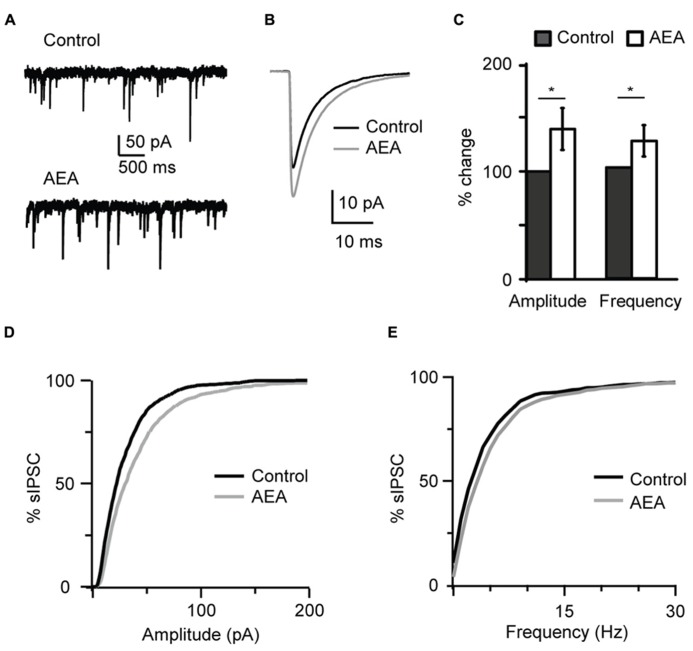
FIGURE 2.
The endogenous CB agonist AEA (anandamide) replicated the effect of WIN 55,212-2 on inhibitory neurotransmission. (A) Example traces of sIPSCs in the absence (Control) and in presence of AEA (1 μM). (B) sIPSC traces averaged across 150 events before (black) and during the perfusion of AEA (gray) for the cell shown in (A). (C) Bar plot summarizing the effect of AEA on sIPSC amplitude and frequency. Amplitude and frequency are represented relative to Control to show fold changes. Black: control; white: AEA. (D,E) Cumulative distributions of sIPSC amplitude (D), and frequency (E) in control (black), and in the presence of AEA (gray). Data are presented as mean ± SEM, statistical significance is indicated by * for P < 0.05.

