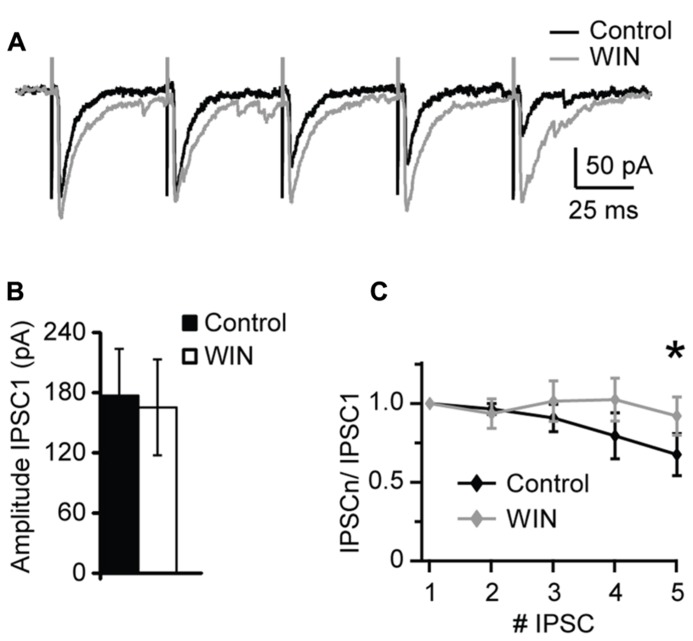
FIGURE 4.
WIN 55,212-2 modulates short-term dynamics of evoked IPSCs. (A) Sample traces of evoked IPSP recorded before (Control; black) and in the presence of WIN 55,212-2 (WIN, 1 μM, gray). (B) Average data of IPSC1 amplitude before and after WIN 55,212-2 application. Black bar: control; white bar: WIN. (C) Average plot of short-term changes in IPSP amplitude in response to five stimuli at 20 Hz. Data are presented as ratio of the first IPSP in the train. Black: control; gray: WIN. Data are presented as mean ± SEM. Statistical significance is indicated by * for P < 0.05.

