FIGURE 6.
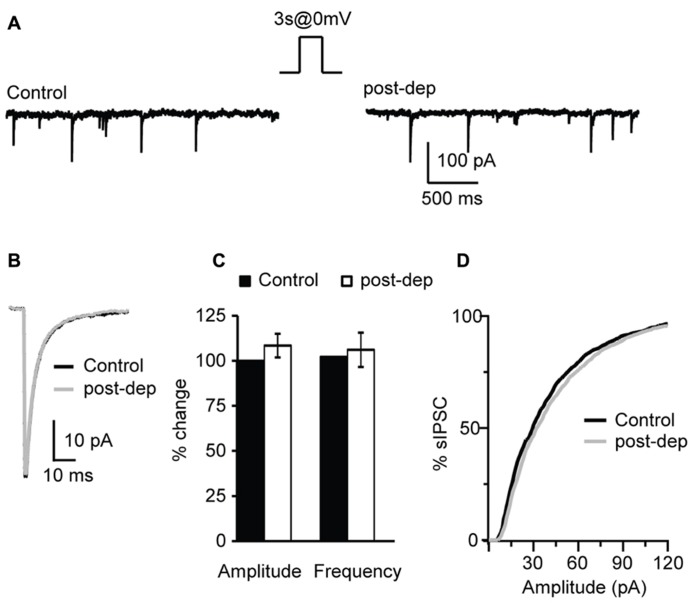
Depolarization of L4 pyramidal neurons does not affect sIPSCs. (A) Example traces of sIPSCs before (control) and immediately after the application of a 3 s long depolarizing pulse from -70 (holding potential) to 0 mV (post-dep). (B) Average sIPSC traces for the same experiment shown in (A). Black: control; gray: post-dep. (C) Group data of sIPSC amplitude, and frequency before (black, control) and immediately after (white, post-dep) depolarization. Data are expressed relative to Control to show fold changes. (D) Cumulative distribution of sIPSC amplitudes in Control (black) and after depolarization (white, post-dep). Data are presented as mean ± SEM.

