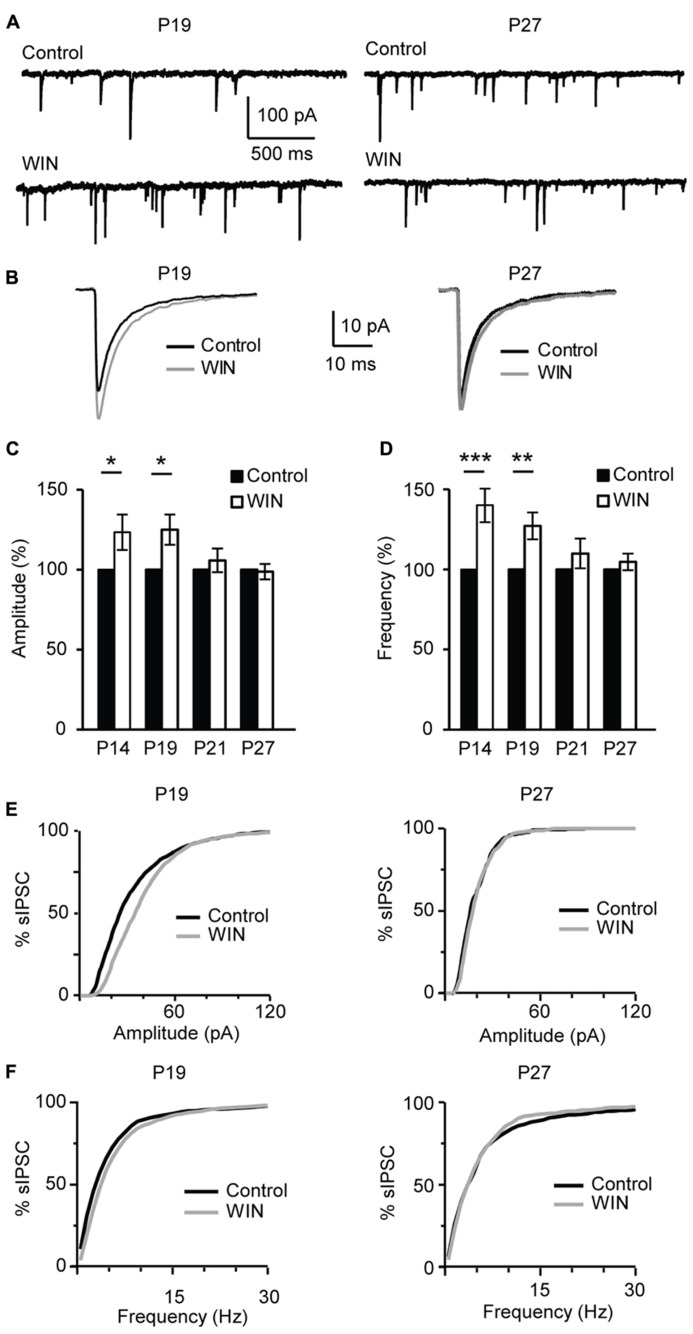
FIGURE 8.
CB-dependent inhibitory potentiation is developmentally regulated. (A) Example traces showing sIPSCs recordings for Control and following WIN application (WIN 55,212-2, 1 μM) at P19 and P27. (B) Average sIPSCs for the conditions shown in (A). Black: control; gray: WIN 55,212-2. (C,D) Bar plot summarizing the effect of WIN 55,212-2 on sIPSC amplitude (C) and frequency (D) by age groups P14 (immediately after eye opening), P19 (pre-critical period), P21 (onset of the critical period), P27 (peak of the critical period). Black: control; white: WIN 55,212-2. Amplitude and frequency are represented relative to the Control for each age group to show fold changes. (E) Cumulative distribution of sIPSC amplitudes for control (black) and WIN (gray) at P19 (left) and P27 (right). (F) Cumulative distribution of sIPSC frequencies for control (black) and WIN (gray) at P19 (left) and P27 (right). Data are presented as mean ± SEM, statistical significance is indicated by * for P < 0.05, ** for P < 0.001, *** for P < 0.001.

