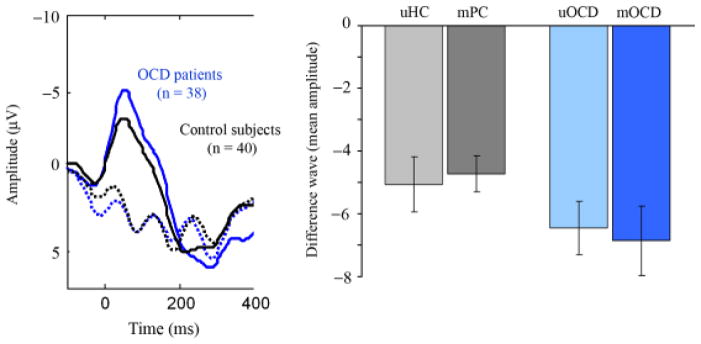
Figure 2.

Error and correct trial waveforms for OCD patients and control subjects. OCD patients (blue lines) exhibited greater amplitude for errors (solid) but not correct trials (dashed) as compared to control subjects (black lines). Bar graph shows the amplitude of the difference wave (error—correct) in each group. uHC=unmedicated healthy controls; mPC=medicated patient controls; uOCD=unmedicated OCD patients; mOCD=medicated OCD patients.
