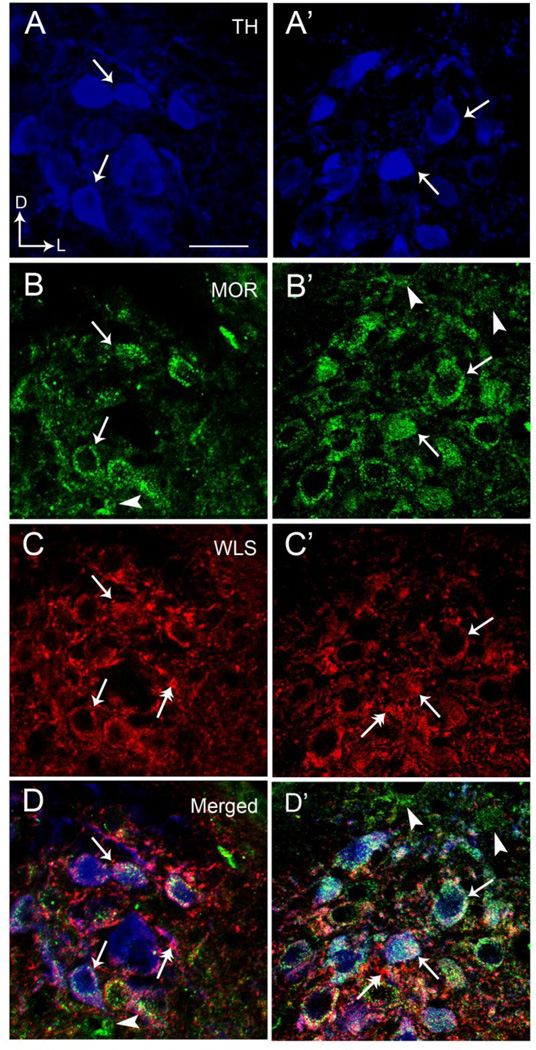
Figure 2.
High magnification immunofluorescence microscopy depicting colocalization of TH, MOR, and WLS in individual rat locus coeruleus (LC) neurons. A and A’ illustrate MOR labeling (green) in the LC, B and B’ show WLS labeling (red) and C and C’ depict TH labeling (blue) in the same tissue. D and D’ represent merged images for all three labels. Solid single black arrows indicate neurons that contain MOR, WLS and TH while arrowheads depict neurons containing only MOR. Dual headed arrows indicate neurons that only contain WLS. Arrows indicate dorsal (D) and lateral (L) orientation of the sections illustrated. Scale bar 20 microns.

