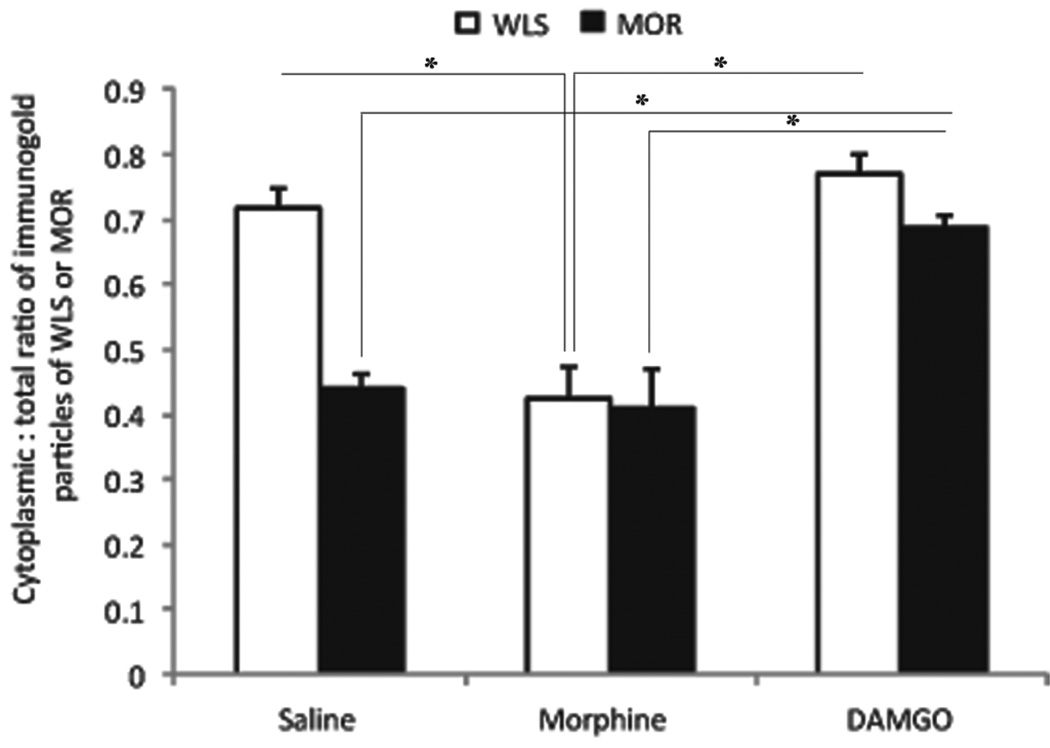
Figure 6.
Ratio of cytoplasmic to total immunogold–silver labeling for WLS and MOR following opiate agonist treatment. Morphine treatment caused a significant (P < 0.05) shift in WLS from the cytoplasmic compartment to the plasma membrane, while MOR remains on the plasma membrane, similar to control. DAMGO treatment significantly increased (P < 0.05) the ratio of cytoplasmic to total WLS immunogold–silver labeling compared to control and morphine treatment. DAMGO also caused a significant shift in MOR distribution to the cytoplasm compared to morphine and control. Values are mean ± SEM of three rats per group. Values with asterisks are significantly different (*P < 0.05) from each other. Tukey’s multiple comparison tests after ANOVA.

