Figure 2.

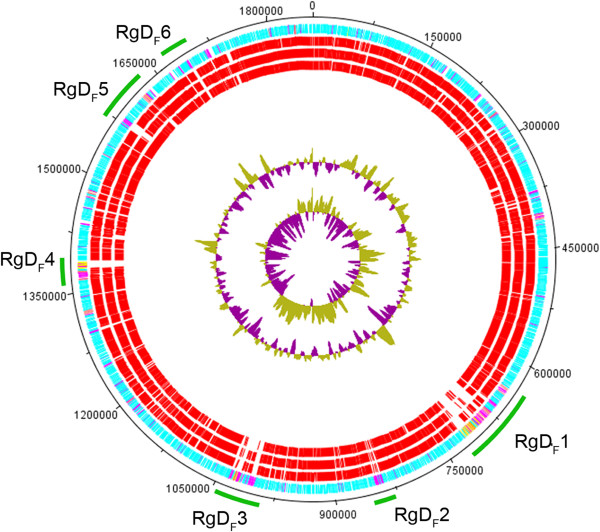
Map of region of differences (RgD F ) of the H. influenzae type f KR494 genome. Circular representation of protein conservation between Hif KR494 and reference strains was visualized using DNA plotter. From the outside in, the outer circle shows the genome length of Hif KR494 with position markers. The second circle shows the total ORFs of KR494 genome predicted on both forward and reverse strands. Common and unique ORFs relative to the reference strains are colored in blue and magenta, respectively. Phage-related ORFs are marked in yellow and orange. The third to fifth circles represent the distribution of individual ORF with high homology (≥85% similarity) (in red) to the corresponding ORF of reference strains, Hib 10810, Hid Rd Kw20 and NTHi 3655, respectively. Gaps between the conserved ORFs represent region of difference in the Hif KR494 genome, and were denoted as RgDF1 to 6 (marked with green lines). The GC plot and GC skew of the Hif KR494 genome are shown in the sixth and seventh circle, respectively.
