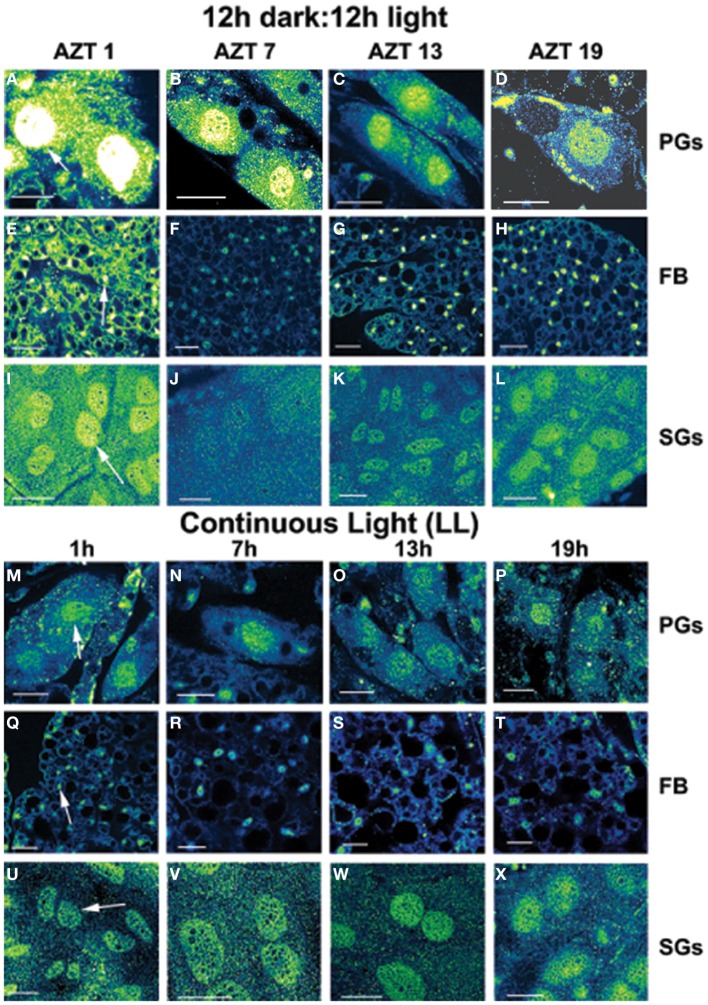
Figure 1.
Daily cycling in vivo in abundance and nuclear localization of PER immunofluorescence (A–L). Green/yellow/white shows fluorescence. Tissue samples were dissected at four times during day 12 after a blood meal: 1 h after lights-off (AZT 1), 7 h after lights-off (AZT 7), 1 h after lights-on (AZT 13) and 7 h after lights-on (AZT 19). (A–D) show PG cells, (E–H) show FB cells and (I–L) show SG cells. Note the cycling of nuclear PER with peaks at AZT 1 (early scotophase). Abolition of daily cycling of PER after exposure to chronic LL in vivo (M–X). Tissue samples were dissected at 6 h intervals in a 24 h period at 1, 7 13, and 19 h. (M–P) show PG cells, (Q–T) show FB cells and (U–X) show SG cells. Arrows in (A,E,I,M,Q,U) show fluorescent nuclei. Scale bars = 10 μm

