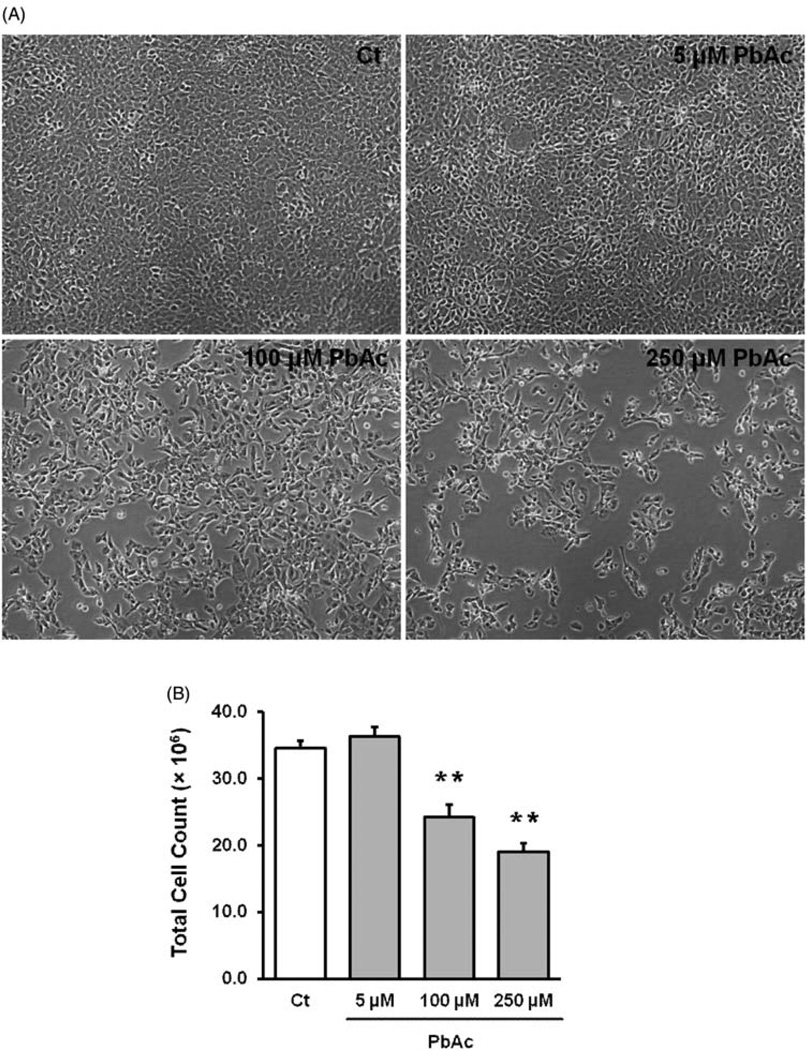
Figure 2.
Effect of Pb exposure on cultured Z3310 cells. (A) Cells were treated with 5,100, and 250 µM Pb for 24 h. The cell morphology appeared normal in the 5 mM Pb group, while the cell numbers were visibly lower in higher Pb dose groups. (B) Dose-response relationship between Pb treatment and total cell counts. Data represent mean ± SD, n=6, **P < 0.01 as compared with the control

