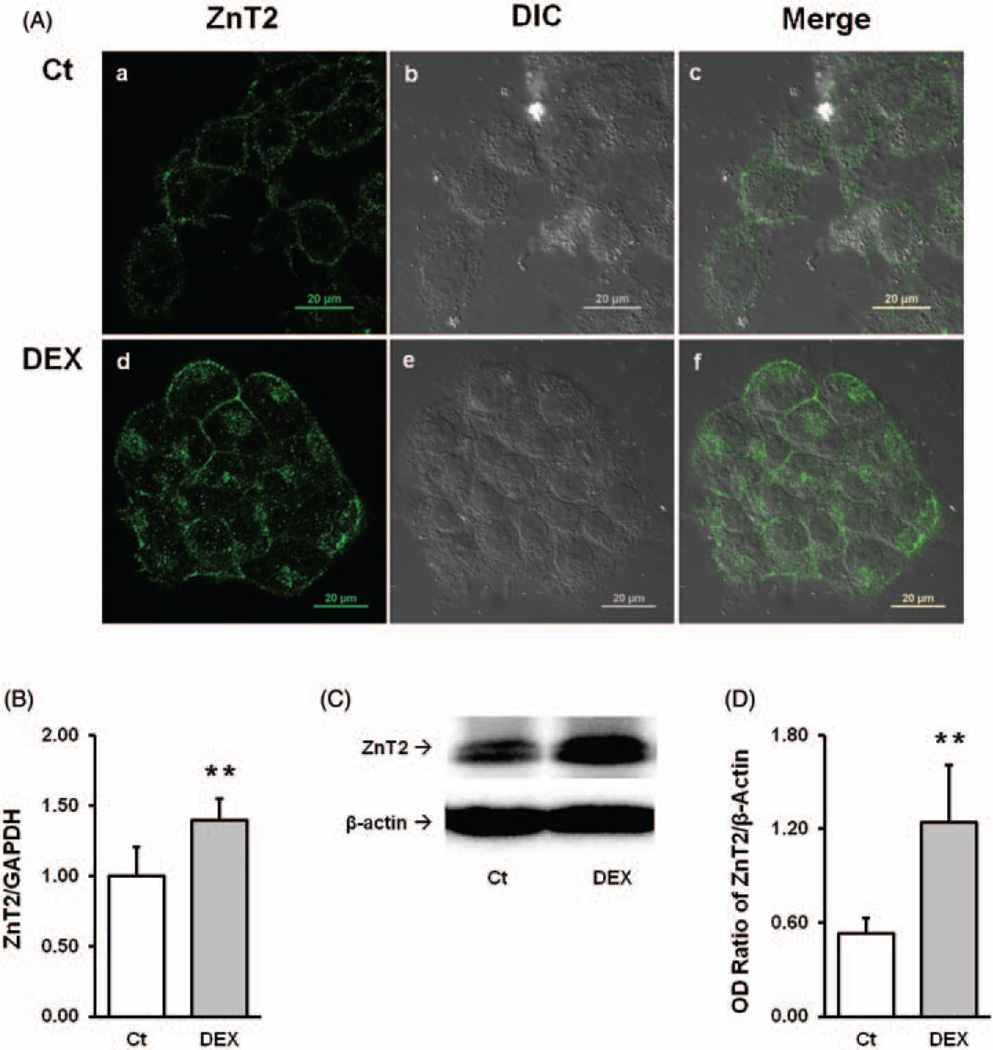
Figure 4.
Upregulation of ZnT2 following DEX exposure. A(a–c)Control images; A(d–f) Pb-treated Z310 cells. A(a) and A(d) show the ZnT2 green fluorescent signal; A(b) andA(c) show the DIC images; A(c) and A(f) are the merged images of ZnT2 fluorescent signal and DIC. (B) qPCR result of increased ZnT2 mRNA expression following DEX exposure. Data represent mean±SD, n=6, **P<0.01 as compared with the control. (C) Western blot result of ZnT2 and β-actin. (D) Quantification of western blot. Data represent mean±SD, n=4, *P<0.01, as compared with the control. (A color version of this figure is available in the online journal.)

