
Figure 3.
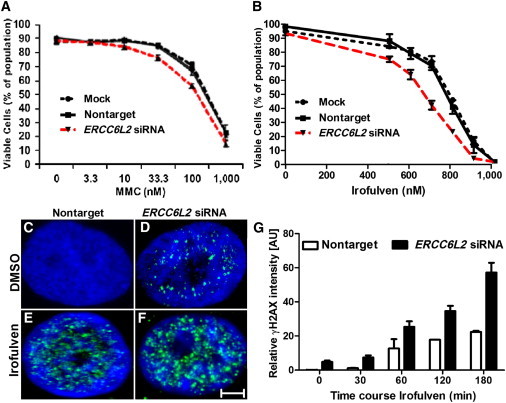
ERCC6L2 Plays a Role in the DNA-Damage-Response Pathway
(A and B) Compared to nontarget-siRNA-transfected cells, ERCC6L2-knockdown cells showed reduced survival after 48 hr treatment with MMC and Irofulven in a dose-dependent manner. Error bars represent the SEM obtained from three independent experiments (one-way ANOVA with Tukey’s test).
(C and D) Compared to nontarget-siRNA-transfected cells, ERCC6L2-knockdown cells revealed γH2AX foci at basal level.
(E and F) γH2AX foci were higher in number in ERCC6L2-knockdown cells than in nontarget-siRNA-transfected cells after treatment with Irofulven. Panels are representative of images taken from different fields of view displaying γH2AX (green) and DAPI (blue). The scale bar represents 5 μm.
(G) The bar graph represents the quantified γH2AX fluorescence value obtained from each individual field of view and normalized to the number of cells stained by DAPI (n > 50) at each individual time point. Error bars represent the SEM (Mann-Whitney test), derived from data obtained from five fields of view at each individual time point from two independent experiments.