
Figure 4.
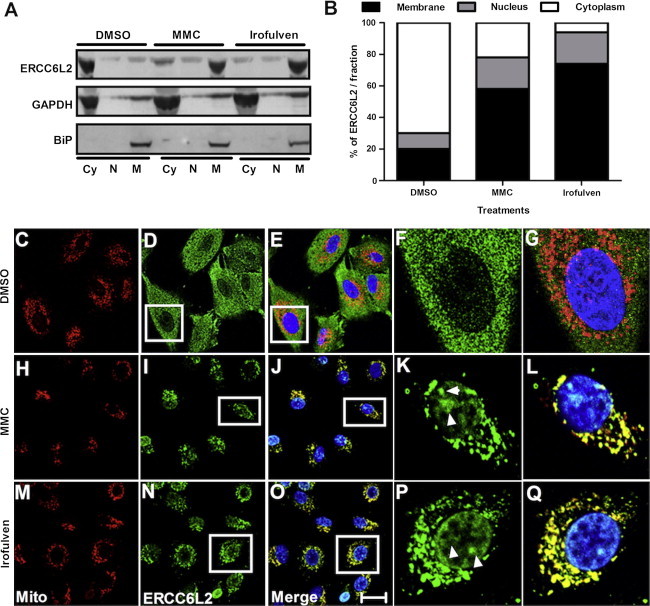
ERCC6L2 Traffics to the Mitochondria and Nucleus after Genotoxic Stress
(A) Immunoblotting was performed on subcellular fractionated protein lysates after MMC and Irofulven treatment with ERCC6L2 antibody. Abbreviations are as follows: Cy, cytosolic; N, nuclear; and M, membraneous. Subcellular fractionation was verified by GAPDH as a cytoplasmic marker and BiP as a membrane marker.
(B) The increased membraneous and nuclear localization of ERCC6L2 is represented graphically by extrapolation of the values acquired from densitometry analysis.
(C–Q) Confocal images show ERCC6L2 localization to the mitochondria and nucleus after genotoxic stress. Nuclear localization of ERCC6L2 (white arrows) showed a correlation with DAPI staining after MMC (I and K) and Irofulven (N and P) treatment but to a lesser extent with DMSO (D and F). Colocalization of ERCC6L2 to the mitochondria is represented in yellow for MMC (J and L) and Irofulven (O and Q) treatment, but not DMSO (E and G) treatment. The colocalization observed was not an artifact of cross-channel noise or bleed from a compliment channel. For colocalization analysis, the Pearson correlation coefficients (r2) of the relative distribution of the two channels in mitochondrial regions of the cells revealed r2 > 0.482 after MMC treatment, r2 > 0.739 after Irofulven treatment, and r2 < 0.03 after DMSO treatment. Images display MitoTracker (red), ERCC6L2 (green), and DAPI (blue). Panels are representative of images taken from different fields of view in three separate experiments. The scale bar represents 30 μm.