
Figure 6.
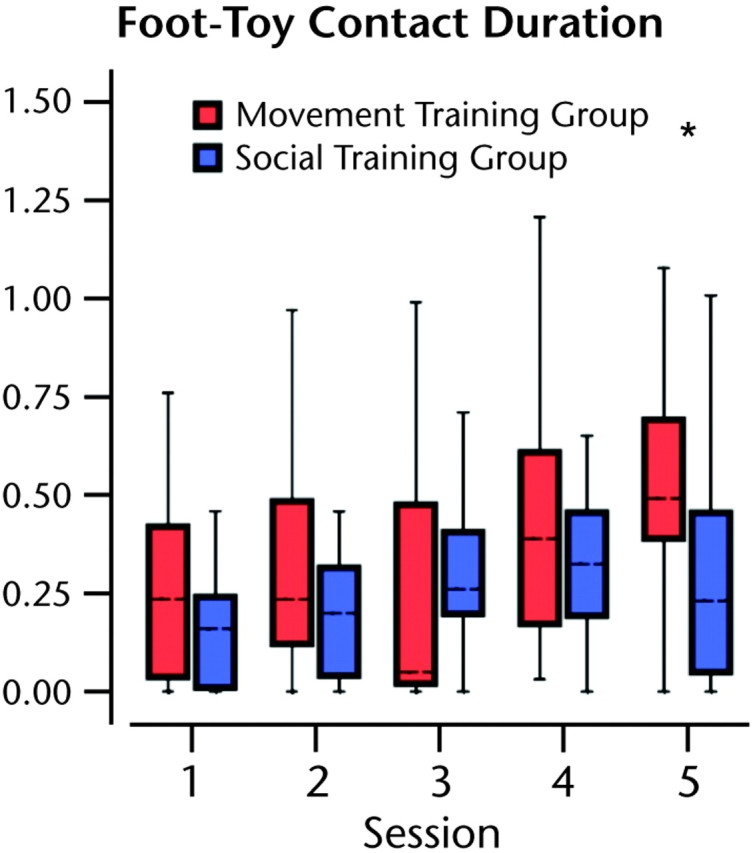
Box plots for the average foot-toy contact duration in seconds; the median for each group is represented by the dashed line. The error bars represent the maximum and minimum values and the top and bottom quartiles of data distribution. The boxes represent the distribution of data from the 2 middle quartiles. The graph shows that there were no changes in foot-toy contact durations over time and that the movement training group had longer durations than the social training group during session 5. Asterisk indicates significant difference between groups at P<.05.