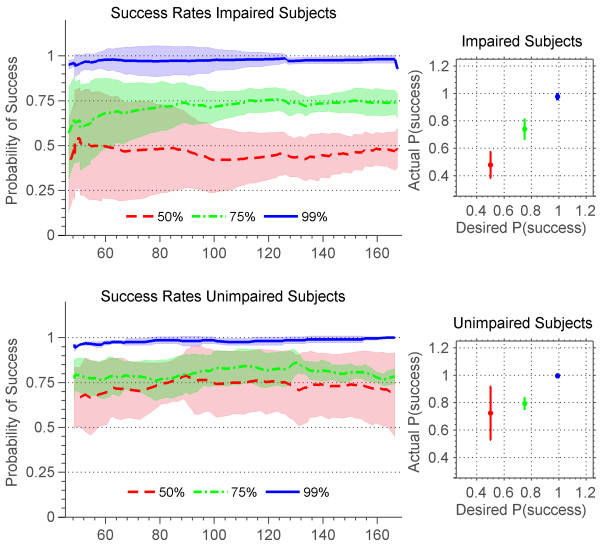
Figure 13.
Actual success rates of stroke and unimpaired subjects. Actual success rates of stroke (top) and unimpaired (bottom) subjects for songs with desired success rates of 50% (red), 75% (green), and 99% (blue). Plots to the left show time progression of success rates. Lines are the moving window average over subjects and the shaded area is the standard deviation. Plots to the right show mean and standard deviation of desired vs. actual success rates at convergence.

