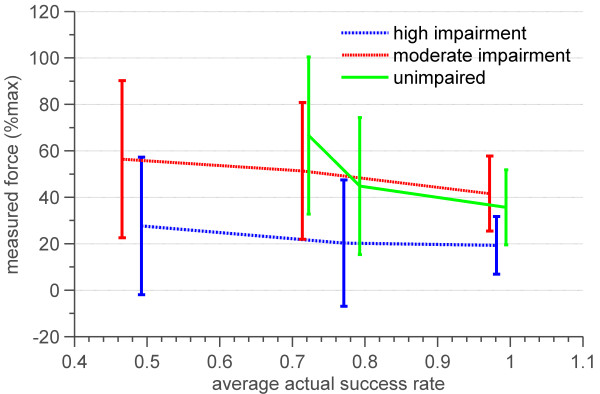
Figure 14.
Average and standard deviation of effort versus average actual success rates for three groups of highly impaired, moderately impaired and unimpaired subjects. Effort was quantified as the peak force subjects generated during blocked notes. This peak force was then normalized to each patient’s maximum force generated during isometric test.

