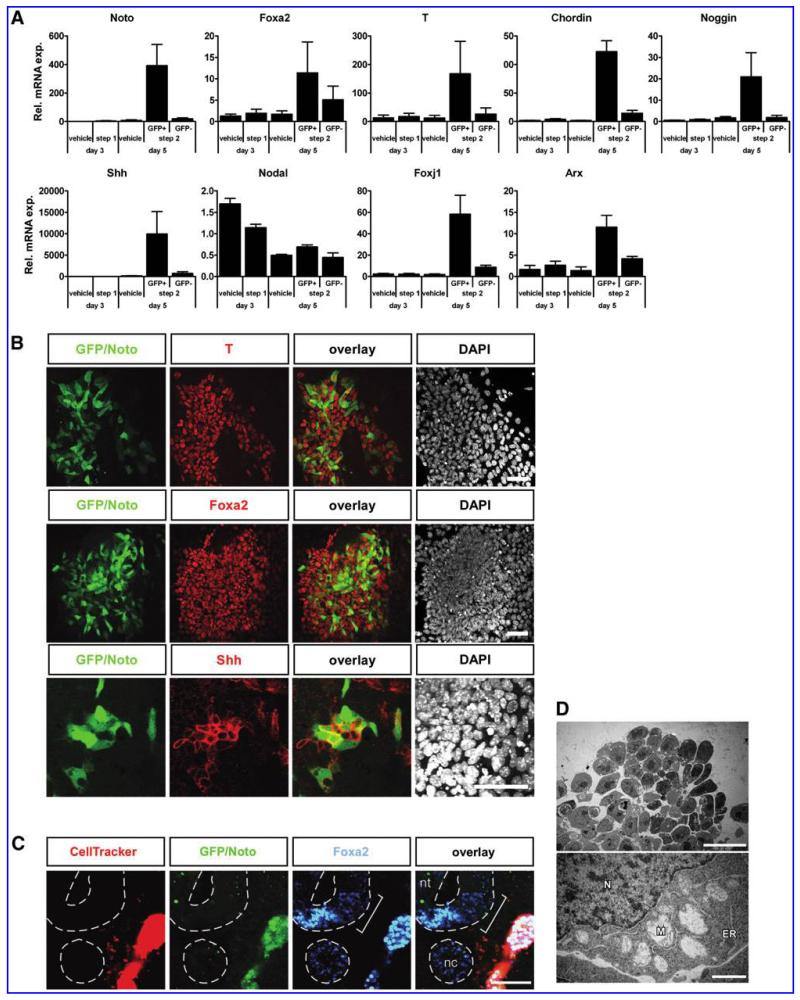
FIG. 3.
Characterization of Noto-GFP + cells. (A) Quantitative reverse transcriptase-polymerase chain reaction analysis of marker expression during differentiation of NotoGfp/+ ES cells. The ratio of gene expression against undifferentiated NotoGfp/+ ES cells is shown. The data represents the mean ± standard error of the mean of at least 3 independent experiments. (B) Immunocytochemistry of T, Foxa2, Shh (red), and GFP (green) in NotoGfp/+ cells was performed at day 5 of the differentiation process. Cell nuclei were stained with DAPI (white). Scale bar = 50 μm. (C) Transverse section of a chicken embryo with the Noto-GFP + graft lateral to the neural tube. The bracket indicates the expanded Foxa2+ region toward the graft. nt, neural tube; nc, notochord; Scale bar = 50 μm. (D) Transmission electron micrograph of Noto-GFP + cell clusters. Note the dilated mitochondria (M) adjacent to the nucleus (N) and undilated rough endoplasmic reticulum (ER). Scale bars = 20 μm (upper) and 1 μm (lower). See also Supplementary Fig. S3. ES, embryonic stem.

