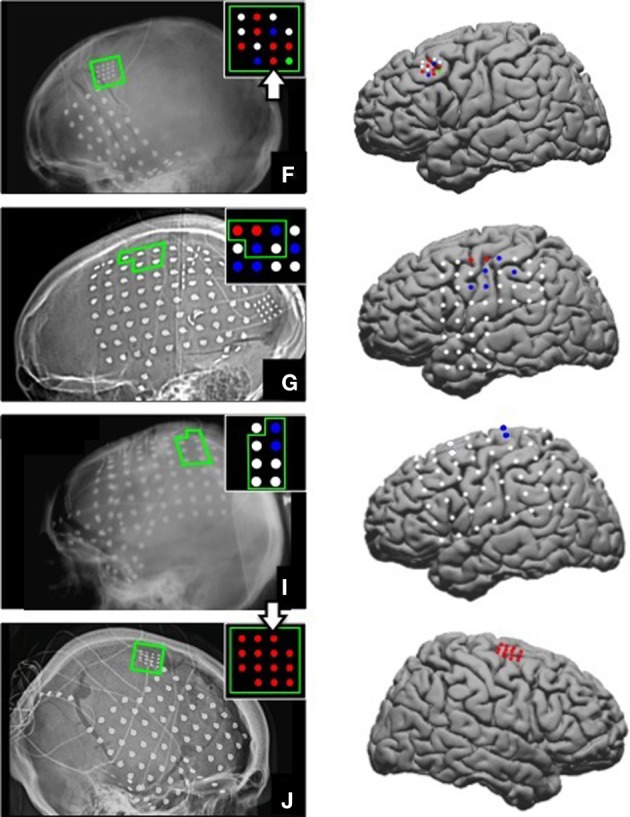
Figure 1.

ECoG grid locations. Left, ECoG grid locations shown on x-ray for Subjects F, G, I, and J. The motor cortical areas are highlighted in green. The schematic inset on each x-ray shows electrodes that were significantly modulated as indicated by the color. Red = Significant modulation during action execution (AE) and observation (AO), Blue = Significant modulation during AE only, Green = Significant modulation during AO only, White = no significant modulation. Electrode positions are shown on a standard brain model to the right of each x-ray using the same color scheme. The two large white arrows (Subjects F and J) mark the two electrodes whose data are shown in Figures 3, 4.
