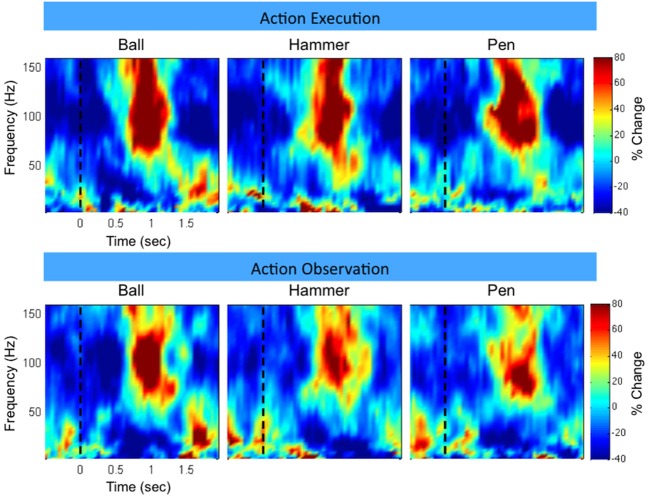
Figure 3.
Example neural activity during action execution (AE) and observation (AO). Example time-frequency plot of neural activity (Subject F, high-density ECoG grid electrode #7) during AE and AO of three grasping tasks (Ball, Hammer, Pen). The color indicates normalized spectral power expressed as the percent change from the average activity of a given electrode. For both conditions, a decrease in low frequency spectral power and an increase in high frequency spectral power were observed with a similar temporal profile. Data was averaged based on stimulus onset (shown as a vertical dotted line at t = 0).

