
Figure 4.
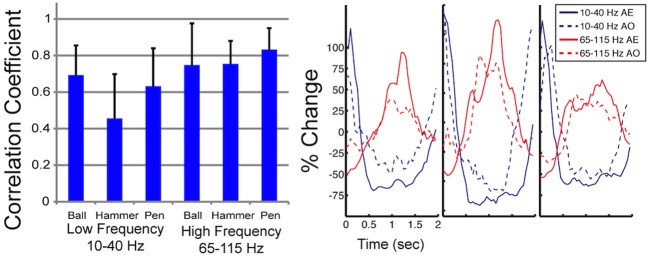
Correlation in spectral power during AE and AO. On the left, the mean correlation between normalized spectral power of the low and high frequency bands measured during AE and AO for three grasp conditions is shown. Correlations were computed for each of the 22 electrodes, from 3 subjects, that exhibited a significant motor response during both AE and AO and then the correlation coefficient values were averaged. Error bars represent the standard deviation. On the right, a sample plot of the average modulation of the low and high frequency bands is shown (Subject J, high-density ECoG electrode #8). Time 0 indicates stimulus onset. Normalized spectral power is reported as the percent change in power from the average response recorded by this electrode over all repetitions.