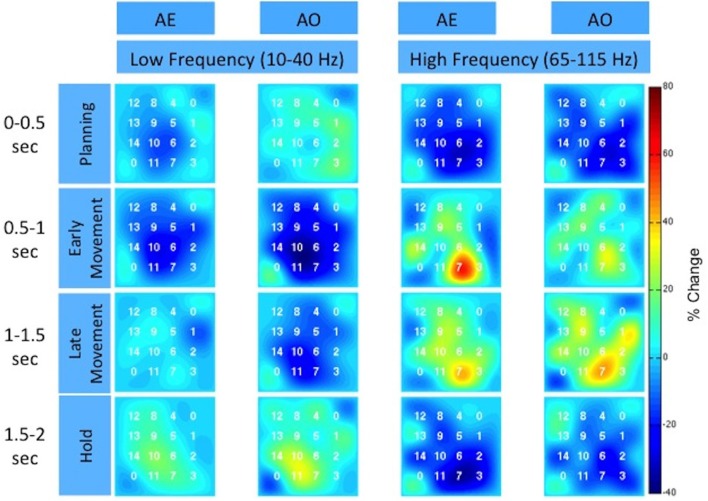
Figure 5.
Spatiotemporal distribution of the low and high frequency band across the high-density ECoG grid for Subject F. The time intervals are relative to stimulus onset. The color indicates the percent change in the spectral power normalized to the average activity recorded by the electrode over all repetitions. The two corner electrodes marked as “0” served as reference channels.

