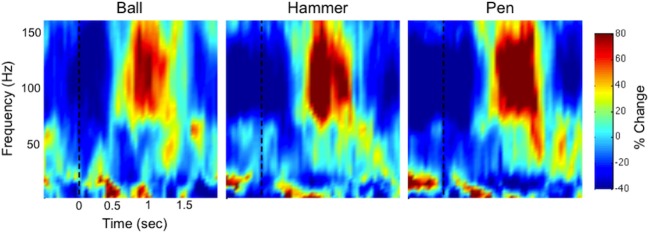
Figure 7.

Example time-frequency plot of neural activity (Subject S, electrode #12 as marked in Figure 6) during action observation (AO) of three grasping tasks (Ball, Hammer, Pen). The color indicates normalized spectral power expressed as the percent change from the average activity of a given electrode. In a person with spinal cord injury, we observed a decrease in low frequency spectral power and an increase in high frequency spectral power that was similar to the responses observed in able-bodied subjects (Figure 3).
