
Figure 4.
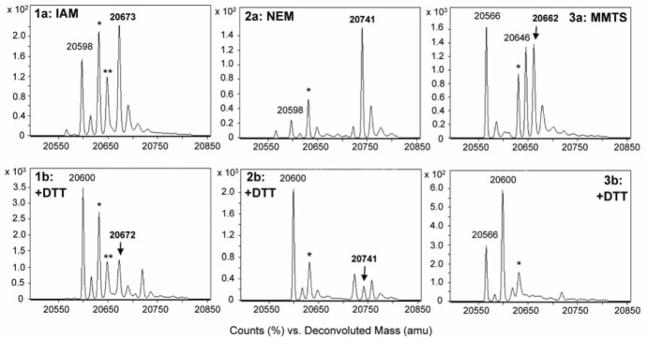
ESI-TOF mass spectra demonstrating (a) the formation of sulfenic acid-electrophile (-SOR) adducts and (b) subsequent reduction by DTT (10 mM, pH 7.5). Adducts in upper panels were generated via incubation of C165S AhpC-SOH (30 μM) with electrophile (2 mM): IAM (1), NEM (2), or MMTS (3) for 3 hours at r.t. Excess electrophile was removed prior to DTT treatment. The signal at 20,598 amu corresponds to sulfenamide (-SN), and the signals at 20,566 and 20,646 amu (3a–b) correspond to cysteine conversion to dehydroalanine (20,566) and AhpC-SH addition to MMTS (20,646). Signals labeled with * and ** indicate 20,632 (-SO2H) and 20,648 (-SO3H) a.m.u., respectively. Evidence for thiol regeneration is indicated by the appearance of a mass peak at 20,600 a.m.u. (-SH) with concomitant loss of signal corresponding to the -SOR adducts.