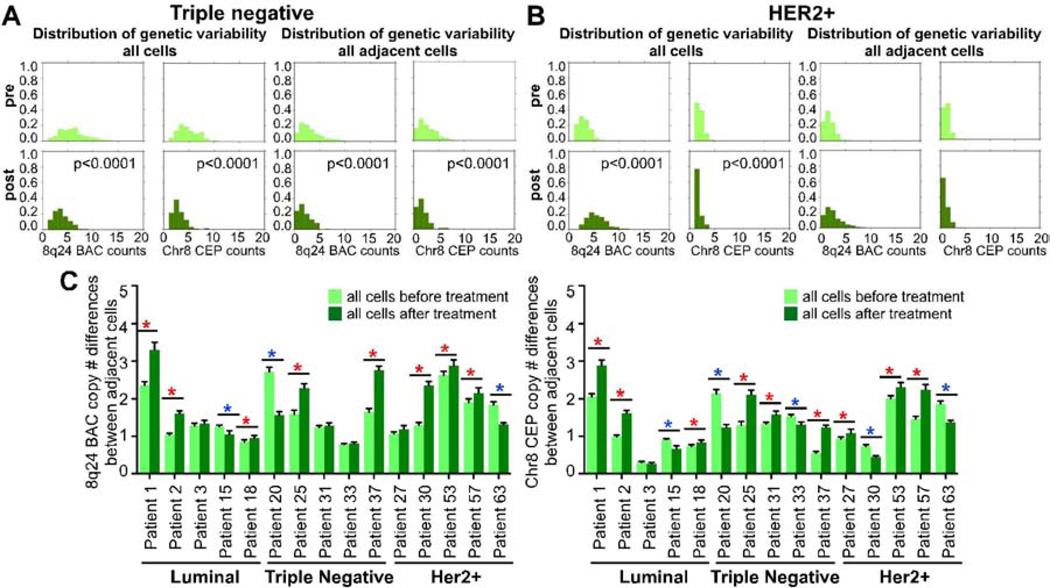
Figure 4. Genotype of all cells and adjacent cells within tumors.
Histograms depicting variability for 8q24 BAC and Chr8 CEP probe counts regardless of phenotype in all cells (left panel) or in adjacent cells (right panel) before and after treatment in a triple negative tumor (Patient 20) (A) and in a HER2+ tumor (patient 30) (B).
(C) Summary of differences for 8q24 BAC or Chr8 CEP probe counts in all cells before and after treatment in the 15 tumors analyzed. Asterisks mark significant differences, red and blue color indicates increase and decrease in differences, respectively. Data is presented as mean ± S.E.M.

