Figure 1.

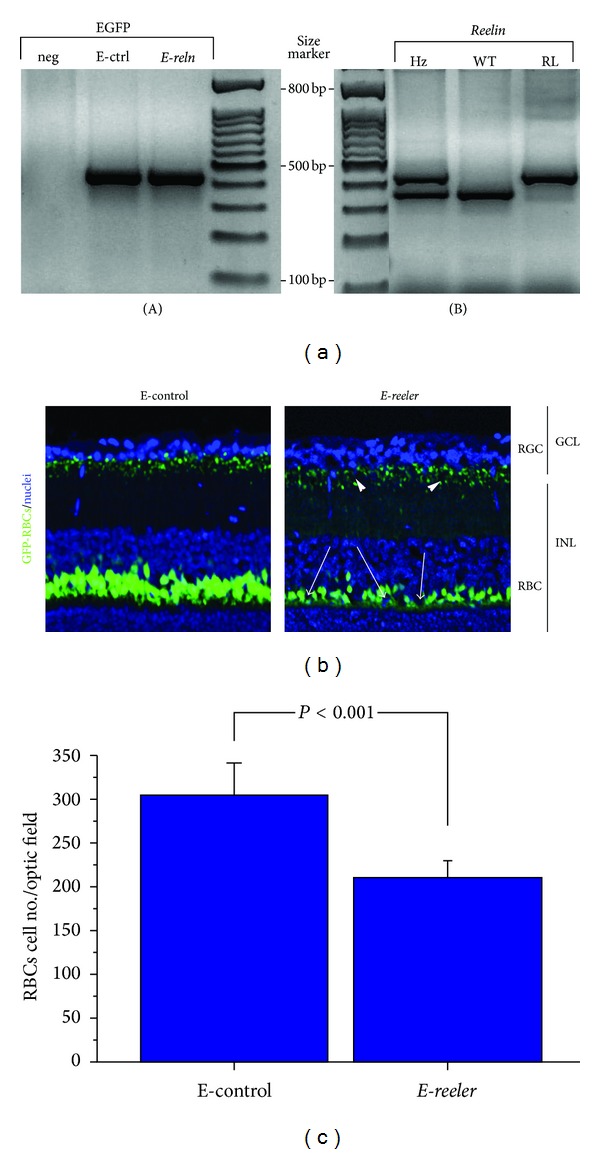
E-reeler model. (a) Agarose gel representative of EGFP and Reelin gene amplification. (A) EGFP expression in E-control (E-ctrl) and E-reeler (E-reln) tail genome, with respect to negative control (neg), not expressing GFP linked to L7-EGFP construct; (B) Reelin expression in control (WT), heterozygote (Hz), and reeler (Rl). The higher band (380 bps) represents reeler status while the lower one (280 bps) represents control rank. (b) Representative confocal microscopy image showing GFP-expressing RBCs (green) and nuclei stained with TOTO3-Iodide (blue). A decrease in the number of RBCs populating the INL is visible in E-reeler retina (arrows), as compared to E-control counterpart. Note the reduction of GFP-fluorescence of both the dendrite length and synapses (GFP staining) indicated by arrowheads in the E-reeler retinas (×400). (c) Number of GFP-bearing RBCs in E-reeler retinas, compared to the E-controls. Note the significant decrease of fluorescent cells (P < 0.001). Abbreviations: GFP, Green Fluorescent Protein; RGCs, Retinal Ganglion Cells; INL, Inner Nuclear Layer; RBCs, Rod Bipolar Cells.
