
Figure 5.
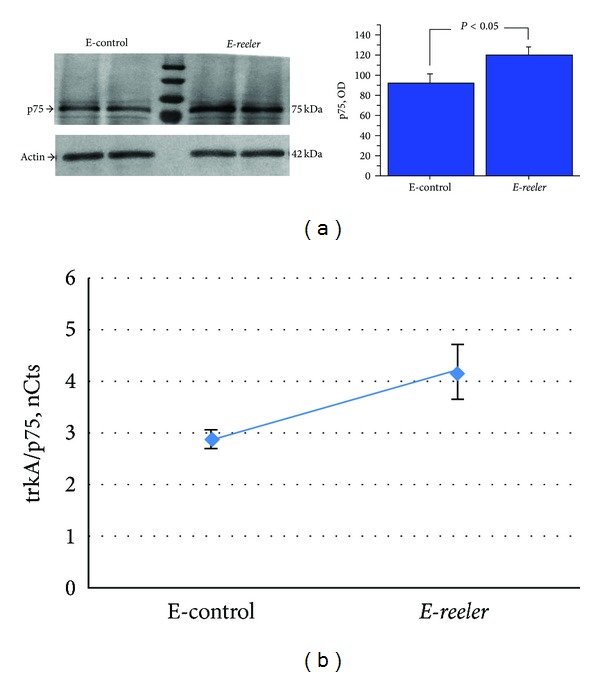
p75NTR expression in E-reeler retina. (a) Representative 7.5% SDS-PAGE and relative densitometric analysis (OD values; P < 0.05), probed with p75NTR antibodies, showing a significant increase of p75NTR in E-reeler protein extracts, as compared to the E-control. (b) Scatter plot showing the correlation with the trkANGFR/p75NTR ratio in the E-reeler versus E-control, highlighting a shift towards p75NTR expression (Tau = 0.857; P < 0.01).