
Figure 3.
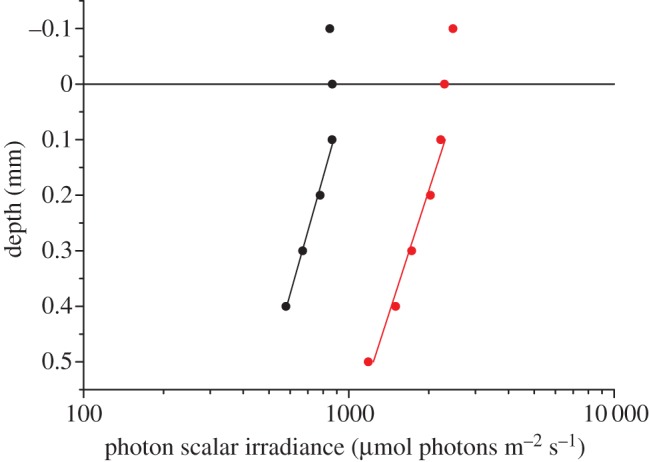
Vertical distribution of photon scalar irradiance (400–700 nm), E0(PAR), in coral tissue under an incident downwelling irradiance of 640 µmol photons m−2 s−1 (black symbols) and 1280 µmol photons m−2 s−1 (red symbols) (n = 3, R2 of exponential fits (solid lines) were 0.99 and 0.98, respectively). y = 0 indicates the position of the tissue surface.