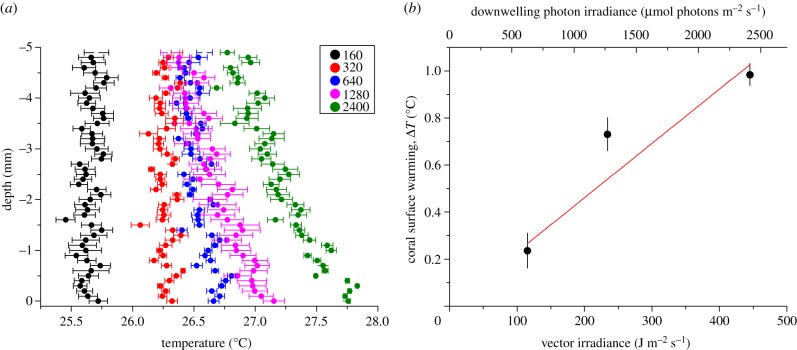
Figure 4.
(a) Vertical microprofiles of temperature (°C) through the TBL under five different downwelling photon irradiances (160, 320, 640, 1280 and 2400 µmol photons m−2 s−1) and a flow velocity of 0.4 cm s−1. Symbols and error bars indicate mean ± s.d.; n = 3. (b) Measured temperature gradients (°C) between the ambient seawater and the coral tissue surface measured at three vector irradiances (116, 234 and 445 J m−2 s−1). R2 of linear fit = 0.98. Error bars are ± s.d. (n = 3).

