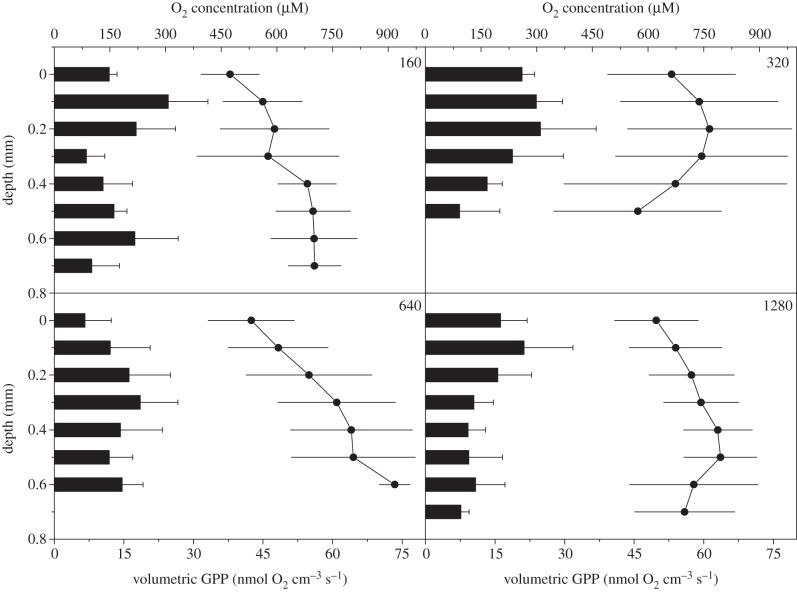
Figure 5.
Vertical microprofiles of volumetric gross photosynthesis rates (in nmol O2 cm−3 s−1) (black bars; bottom x-axis) and the corresponding O2 concentrations (in µM) (line and symbols; top x-axis) measured under four different downwelling photon irradiances (160, 320, 640 and 1280 µmol photons m−2 s−1). Error bars indicate ± s.d. (n = 3).

