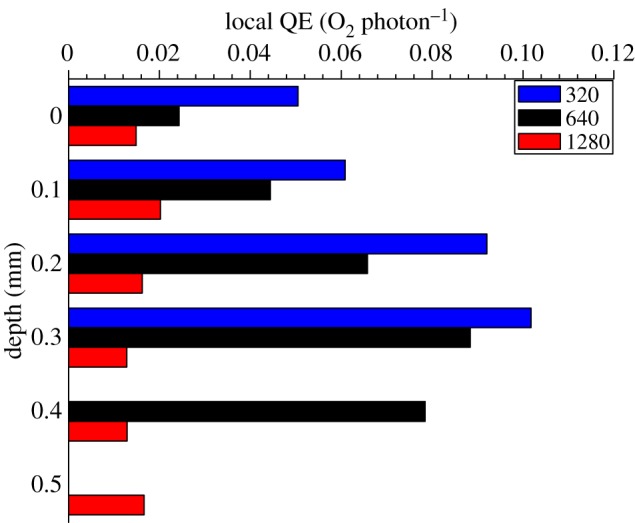
Figure 7.

Vertical microprofiles of the local photosynthetic quantum efficiency (QE) (η) in the studied coral (in units of mol O2 produced per mol photon absorbed) under three different incident photon irradiances noted as colour bar legends (in µmol photons m−2 s−1). y = 0 indicates the position of the tissue surface.
