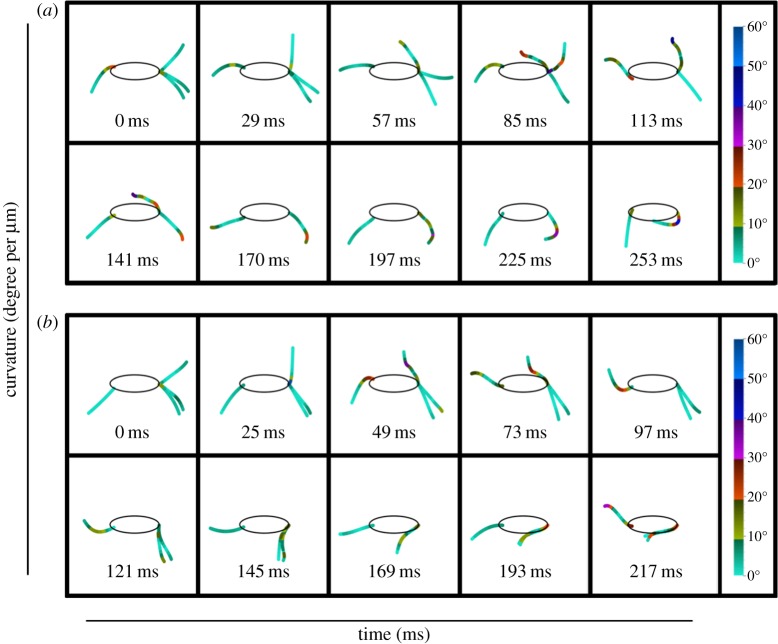
Figure 3.
Curvature changes along the length of each flagellum during the entire recovery stroke of linear swimming and turning. The zero point of each flagellum was the point of exit from the cytoplasm. Curvature was then calculated at equally distributed intervals along the length of the flagella (10% increments). The magnitude of curvature at each increment is shown by the gradient colour bar. When comparing the changes in curvature between linear swimming (a) and turning (b), it is apparent that differences exist between the strokes, both in the magnitude of the curvature and the time phase of bending.

