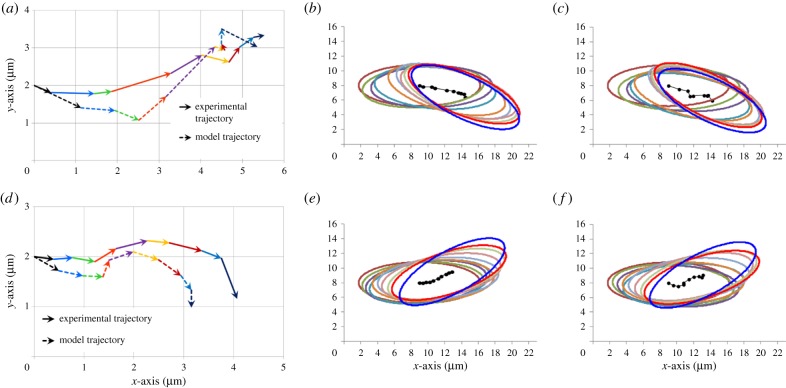
Figure 5.
Experimental and model-derived trajectories for linear swimming and turning in both the body-aligned frame and laboratory frame. (a) Comparison of the experimental and optimized model-derived trajectories for linear swimming in the body-aligned frame. The vectors from each time point are shown as a different colour throughout the course of the stroke. The shape of the trajectories is similar and the trajectories end at similar points. (b) Experimental trajectory of an average cell displaying the linear swimming pattern with its flagella. Ellipses have been superimposed around the centre of mass to indicate the angular change of the cell. All cells start at the same position and travel in the positive x-direction. Despite variations around a central line, the cell proceeds along a linear path with minimal angular changes from the starting and ending points. (c) Model trajectory in the laboratory frame using the flagella input from the average linear swimming flagella traces. (d) Comparison of the experimental and optimized model-derived trajectories for turning in the body-aligned frame. Note that there is a slight reduction in the x-component of the trajectory, with an increased y-component. (e) Experimental trajectory of an average cell using the turning beating pattern. During turning, the cell has reduced motion in the forward (positive x) direction and has a large angular change of approximately 30° from its starting orientation. (f) Model trajectory in the laboratory frame using the flagella input from the average turning flagella traces. Note that over the course of each stroke the cell follows the same trajectories and angular changes as the experimental trajectories.

