
Figure 8.
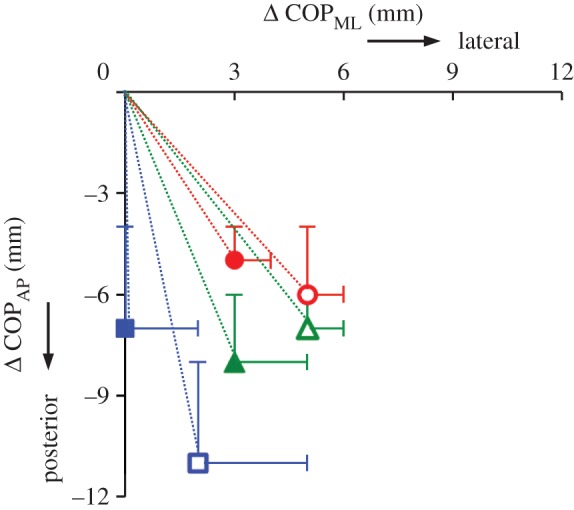
Changes in centre of pressure (COP) position owing to intrinsic foot muscle stimulation. Mean ± s.e. for COP in the mediolateral (COPML, x-coordinate) and anteroposterior (COPAP, y-coordinate) directions occurring owing to electrically evoked contractions in abductor hallucis (red circle), flexor digitorum brevis (blue square) and quadratus plantae (green triangle) with both 50% (open) and 100% (filled) loading conditions. Changes in COP position were calculated by subtracting the COP position immediately prior to stimulation from the subsequent maximum COP displacement that occurred during muscle stimulation, such that 0,0 (x,y) represents the COP position prior to muscle stimulation, for all conditions. Stimulation of AH, FDB and QP produced significant changes in COP position in both loading conditions (all p ≤ 0.05). (Online version in colour.)