
Figure 2. Temporal evolution of biomarkers.
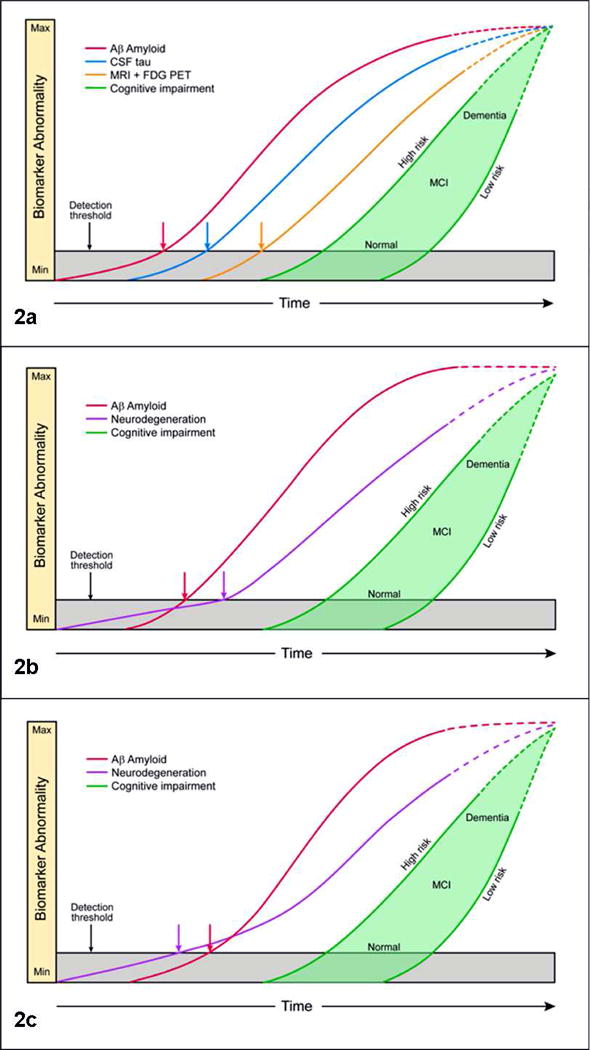
Fig 2a, biomarker model of pure AD. The horizontal axis is time and the vertical axis severity of biomarker abnormality from completely normal (min) to abnormal (max). The threshold for biomarker detection of pathophysiology is denoted by a horizontal line. The grey area denotes the zone in which abnormal pathophysiology lies below the biomarker detection threshold. Amyloid biomarkers become abnomral first, followed by CSF tau, followed by FDH PET and MRI. Cognitive impairment (green filled area) is the last event in the progression of the disease. A range of cognitive responses are possible that depend on the individual's risk profile. The cognitive response curve is shifted to the left for those with low cognitive reserve and to the right for those with high cognitive reserve. At a given point on the disease time line, a person with high cognitive reserve can be cognitively normal while a low cognitive response person with the same biomarker profile can be impaired. All biomarker curves (as well as cognitive impairment) are configured as sigmoids, but the curves have a progressively steeper slope in the right-hand tail for later-changing biomarkers. The right hand tails of the curves are dashed indicating that biomarker trajectories in end stage dementia are unknown at this time. MCI = mild cognitive impairment. Fig 2b, amyloid-first biomarker model of late onset AD where comorbid pathologies are likely. Figure labels are as in Fig 2a, except here the CSF tau, structural MRI and FDG PET are grouped under the generic neurodegenerative label. This reflects the fact that neurodegenerative biomarkers can be non-specific and that the proportional contribution of various possible etiologies to neurodegeneration cannot be known in vivo. We assume that in elderly individuals tauopathy and in many individuals non-AD neurodegenerative pathologies arise first but lie beneath the detection threshold of biomarkers of neurodegeneration. Aβopathy arises later independently and is the first AD biomarker to become positive. The neurodegeneration curve has a shallow slope initially, but the slope steepens after the onset of amyloidosis. Fig 2c, neurodegeneration-first biomarker model of late onset AD where comorbid pathologies are likely. Figure labels are as in Fig 2a, except here one or more neurodegenerative biomarkers become abnormal first reflecting the onset of tauopathy and in some individuals other neurodegenerative pathologies prior to amyloid. Observing the onset of an abnormal neurodegenerative biomarker prior to an abnormal amyloid biomarker does not alter the role of amyloid as an inducer of neurodegeneration. This is indicated by showing the neurodegeneration curve with a shallow slope initially which steepens after the onset of amyloidosis.