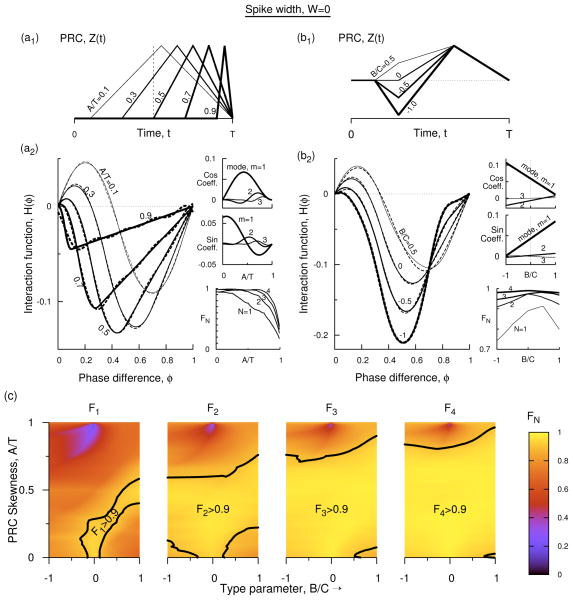
Figure 2.
(Color online) Interaction function at zero spike width. (a1) Profile of type-1 PRC with B′ = 0, at five different skewness values. (a2) Analytically determined H(φ) (Eq. 9) for the five PRCs of (a1). The dashed curves for A′ = 0.1, 0.3, 0.5, and 0.7 are Fourier approximations in Eq. 11. For A′ = 0.9 up to eight modes are needed, but the curve is plotted using only four modes in order to compare with the other curves. In the side panels the coefficients of cosine terms [cos(m2πφ]), and the sine terms [sin(m2πφ)] in the discrete Fourier spectrum of H(φ) for the first three modes are displayed for all levels of skewness. The side panel also displays FN for N = 1, 2, 3, and 4 as a function of normalized skewness. (b1) Profile of type-2 PRC at four different levels of B′, and fixed skewness of A′ = 0.3. (b2) H(φ) for the PRCs in b1 using Eq. 7 (solid) and Fourier approximations (dashed, Eq. 12). The side panels are similar to those in b2 but as a function of type parameters at A′ = 0.3. (c) The weight factor FN that captures the relative Fourier power in modes 1 to N in the parameter space of skewness and B′ as incrementally more number of modes are included in an expression for H(φ) in terms of its Fourier expansion terms. The black dots indicate the contour lines on which FN = 0.9. The brighter yellow parameter regimes bordering the dotted boundaries can be represented by the given or fewer number of Fourier modes, and contain 90% or more total power in them. For example, in the region marked F4 > 0.9 in the last panel the interaction function could be approximated by either 4 or fewer modes.

