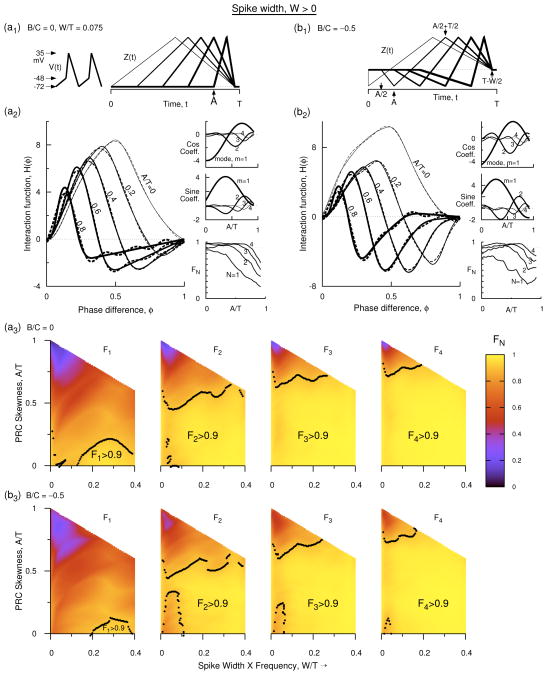
Figure 3.
(Color online) Interaction function at non-zero spike width. (a1) Voltage time course with W′ = 0.075 used in all the figure panels, and profile of type-1 PRC with B′ = 0 at five different skewness values. (a2) Numerical H(φ) (solid) for PRCs in a1, and Fourier approximations for four of the curves as in Eq. 13. The approximation for A′ = 0.8 requires 5 modes but only four modes are used for comparison with the other curves. The side panels are similar to those in Fig. 2. (b1) Profiles of five type-2 PRCs at a fixed skewness of A′ = 0.3. (b2) Same as that in a2 but for the type-2 PRCs described in b1. The Fourier approximations are as in Eq. 14. (a3, b3) Fourier weight coefficient (FN) shown in the parameter space of skewness and B′ as incrementally more number of modes are included in an expression for H(φ) in terms of its Fourier modes. The black dots indicate the contour lines on which FN = 0.9 for the corresponding N. The brighter yellow parameter regimes bordering the dotted boundaries (FN > 0.9) can be represented by the given number of Fourier modes that contain 90% or more total power in them. Type-1 PRC is illustrated with B′ = 0 in a3 and type-2 PRC with B′ = −0.5 in b3.

