Figure 4.
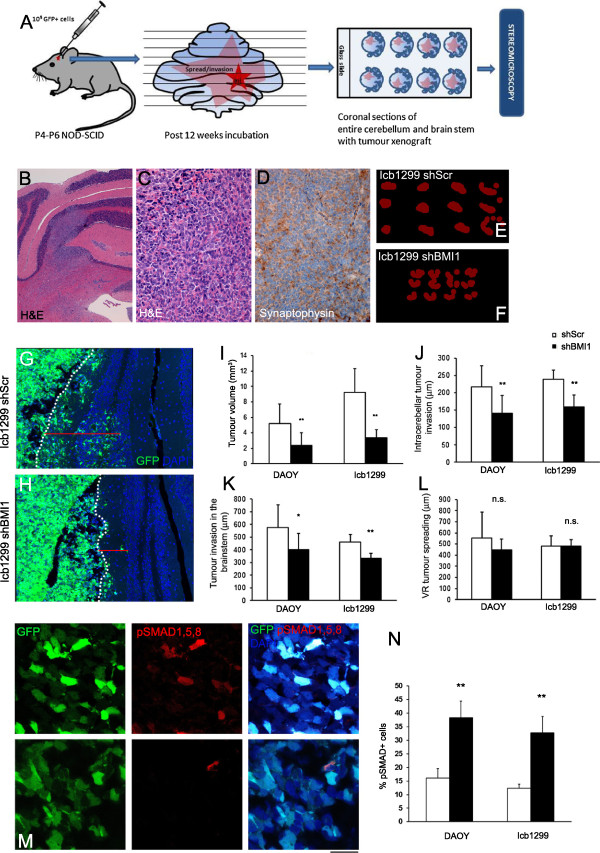
Tumour volume and parenchymal invasion is controlled by BMI1 in an orthotopic MB xenograft model. (A) Schematic showing generation and analysis of orthotopic MB xenografts. (B-D) Histology of the ICb-1299 xenografts shows a multifocal poorly differentiated tumour in the cerebellum, which show widespread Synaptophysin expression. (E-F) 2D representation of tumour volume estimates by Cavalieri probe using Stereo Investigator software. The overlapping tumour areas marked during Stereomicroscopic evaluation are represented in red (20 μm grid spacing used). (G-H) Confocal images showing a reduced intra-cerebellar invasion of GFP labelled ICb-1299 cells in shBMI1 xenograft (H) when compared to shScr (G). The depth of invasion (μm) is measured from the deepest cell to the pial surface (dotted line) (N ≥ 6 in each group). (I) Quantification of tumour volume estimated by Cavalieri probe using Stereomicroscope, showing reduced volume (mm3) in shBMI1 group compared to shScr group in both DAOY and ICb-1299 xenografts. (J-K) The average distance of invasion (μm) of tumour cells from the pial surface into the cerebellar parenchyma (J), and into the Brain stem (K), show a reduction in shBMI1 groups in both DAOY and ICb-1299 xenografts. However, the average distance of spread of tumour cell along the Virchow Robin space is not significantly different (L). The distances were quantified using acquisitions from Confocal microscopy (N ≥ 6). (M) pSMAD1,5,8 immunohistochemistry in ICb-1299 xenografts showing aberrant activation of BMP pathway in ICb-1299BMI1kd (upper panel) as compared to ICb-1299Scr (lower panel) (N) Quantification of percentage of pSMAD1,5,8 expressing cells in selected xenografts (N = 3). Scale bar 1 mm (B), 125 μm (C, D, G, H) and 50 μm (M). Error bars in graphs represent SD. *, P < 0.05; **, P < 0.01. Abbreviations: H&E, Hematoxylin and Eosin; GFP, Green Fluorescent Protein; DAPI, 4′,6-diamidino-2-phenylindole.

