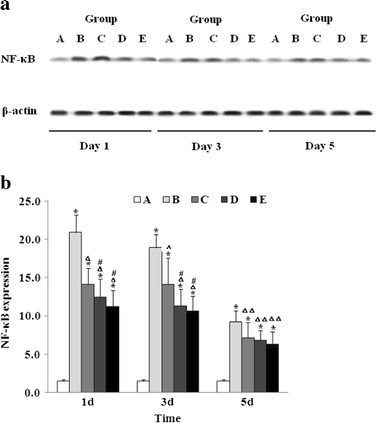
Fig. 5.

Baicalin suppressed NF-κB protein expression following ICH. a At each time point, the NF-κB expression was determined by western blot as described in “MATERIALS AND METHODS”. The quantitation represents the average relative ratio of NF-κB protein to β-actin per animal (n = 6 for each group). Asterisk indicates P < 0.01 vs. group A; triangle, P < 0.05 vs. group B; double triangle, P < 0.01 vs. group B; and number sign, P < 0.05 vs. group C. Group A is the control group; group B, vehicle-treated ICH; group C, baicalin (25 mg/kg)-treated ICH; group D, baicalin (50 mg/kg)-treated ICH; group E, baicalin (100 mg/kg)-treated ICH. b Representative experiments of western blot for the NF-κB expression (n = 6 for each group).
