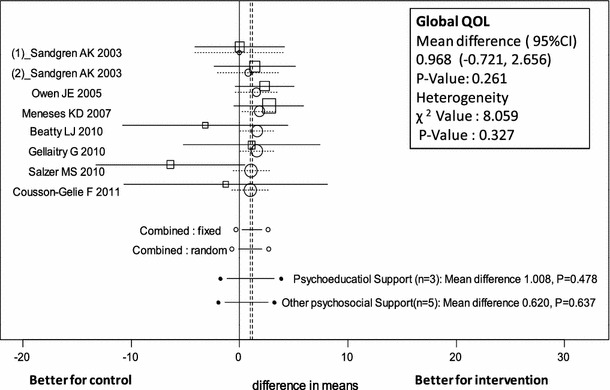
Fig. 2.

Forest plot of mean difference in Global QOL scores of patients receiving psychosocial support (psychoeducational and other psychosocial support) with 95 % CI for each study, overall for several models (circles represent cumulative meta-analysis)
