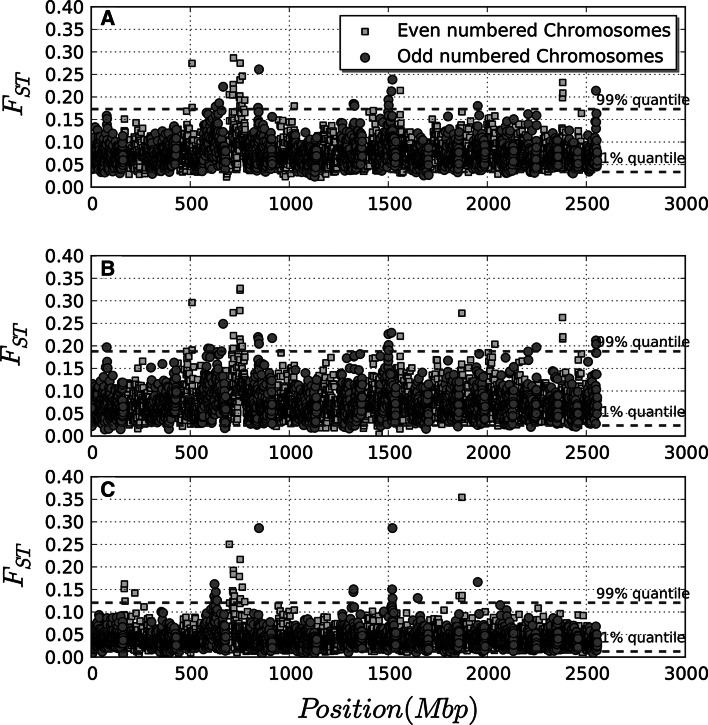
Fig. 1.
Genome wide Manhattan plots of fixation index (F st) calculated for all polymorphisms averaged over a window of 8 SNPs within each chromosome and calculated for all five breeds (a), dairy breeds (b) and beef breeds (c). F st for odd and even chromosomes are represented with blue circles and red squares, respectively. The values corresponding to the lowest 1 and 99 % quantiles are represented with green dashed lines. (Color figure online)

