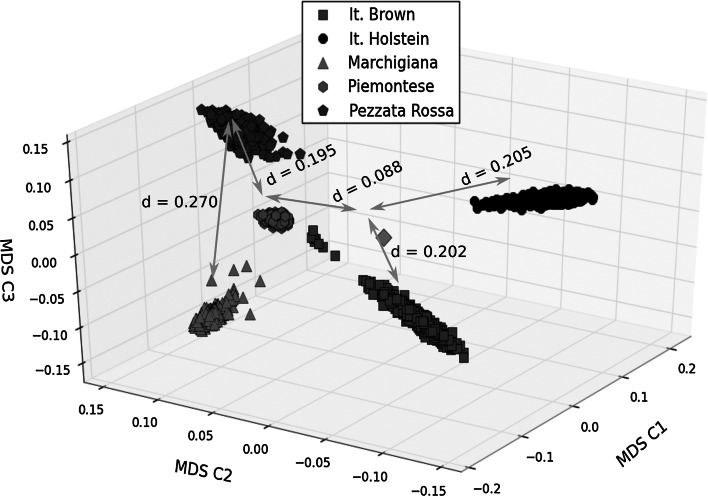
Fig. 4.
Classical multidimensional scaling plot of genomic distance calculated as 0.5—genomic kinship for all five breeds. The first three components are shown as C1, C2 and C3, respectively. Subjects are depicted as grey squares (Italian Brown), black circles (Italian Holstein), red hexagons (Italian Pezzata Rossa), blue triangles (Marchigiana), green pentagons (Piedmontese), respectively. The centre of mass of the complete distribution is represented as a magenta diamond and relative distances between each cluster centre or between any cluster and the general centre is indicated by cyan arrows and annotated in the figure. (Color figure online)

