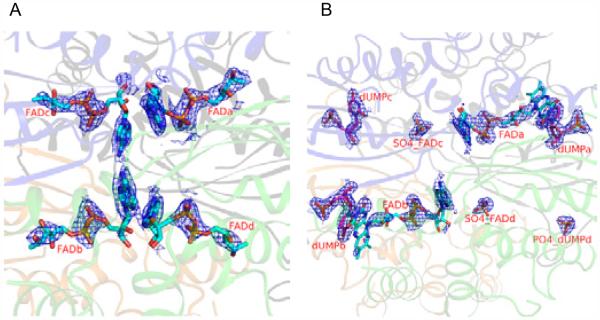
Figure 2.
A view of the electron density map at the four active sites of H53D+FAD and H53D+FAD+dUMP complexes.
A) Electron density for FAD molecules H53D+FAD complex. B) Electron density for FAD and dUMP in the H53D+FAD+dUMP complex. The 2Fo-Fc electron density around the ligand atoms are contoured at 1.0 sigma. Ribbon drawings for the protein chains and stick representation for FAD (SO4) and dUMP (PO4) molecules. The SO4 or PO4 densities observed in these binding sites are labeled (e.g., SO4_FADc indicates SO4 at the FAD binding site in chain C).

