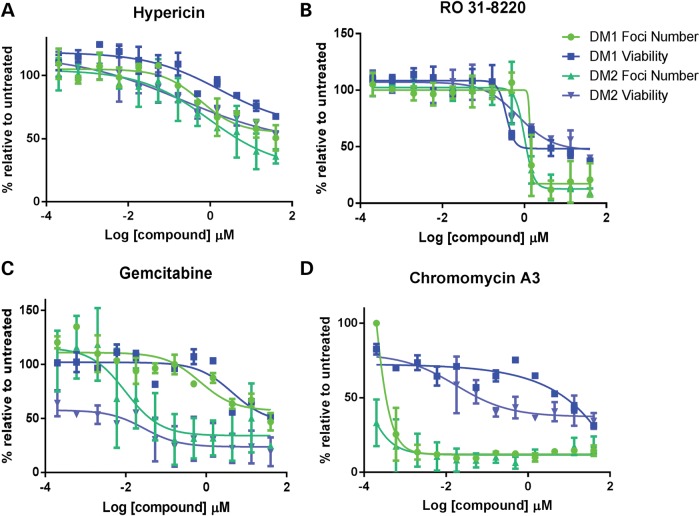
Figure 2.
Compound treatment and toxicity profiles. Standard concentration curves showing the effect of compound treatments in KBTeloMyoD cells (DM1) and KagoTelo cells (DM2) in which the percentages of foci (green) and cell viability (blue) are represented relative to DMSO treatment on the ‘y’-axis. Compound concentration (log μm) is indicated on the ‘x’-axis for hypericin (A), Ro 31-8220 (B), gemcitabine (C) and chromomycin A3 (D).

