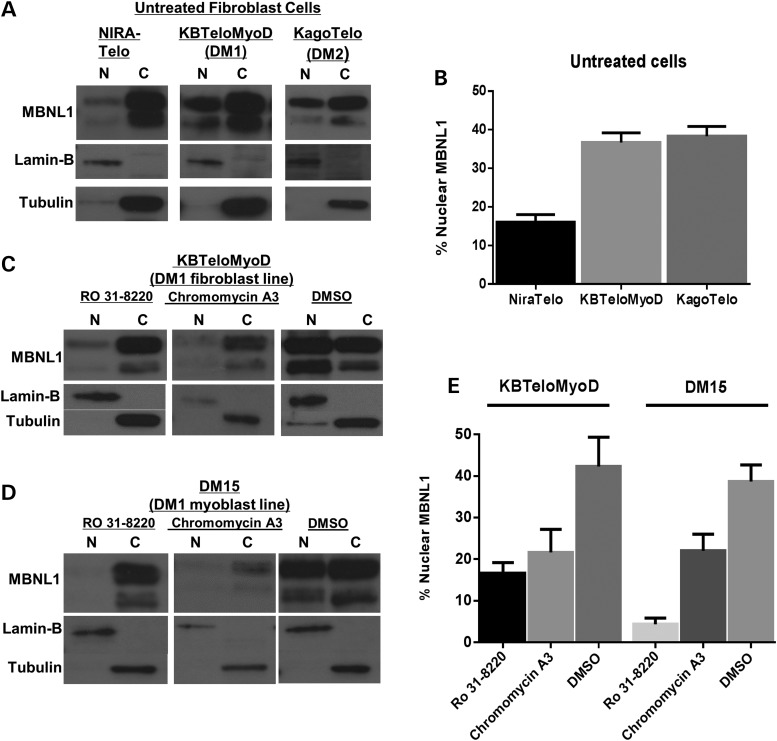
Figure 3.
The subcellular distribution of MBNL1. (A) Western blots showing the distribution of MBNL1 in nuclear (N) and cytoplasmic (C) compartments of cell lines NIRATelo (control), KBTeloMyoD (DM1) and KAGOTelo (DM2). (B) Histograms show data compiled from intensity scans of triplicate blots for each cell line, normalized against values for lamin-B and tubulin. (C and D) Western blots showing the distribution of MBNL1 in nuclear (N) and cytoplasmic (C) compartments of fibroblast cell line KBTeloMyoD (DM1) (C) and DM1 myoblast cell line DM15 (D) following treatment with Ro 31-8220 (10 μm), chromomycin A3 (40 nm) and DMSO. (E) Histograms are shown of data compiled from intensity scans of triplicate blots for cell lines KBTeloMyoD and DM15 following treatment with Ro 31-8220 (10 μm), chromomycin A3 (40 nm) and DMSO normalized against values for lamin-B and tubulin.

