Figure 4.
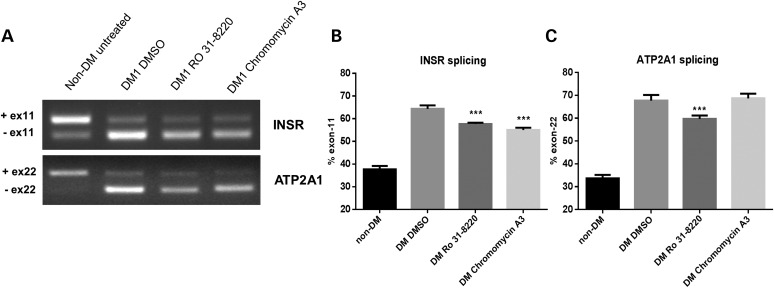
The effect of compound treatment on INSR and ATP2A1 alternative splicing. (A) Ethidium-stained agarose gels show RT–PCR fragment analysis of INSR and ATP2A1 splicing in DM differentiated fibroblast cell lines compared with non-DM differentiated fibroblast cells following treatment with Ro 31-8220 (10 μm), chromomycin A3 (40 nm) and DMSO (control). (B) Histograms show the percentage of INSR transcripts with the minus exon 11 isoform following compound treatment. (C) Histograms show the percentage of ATP2A1 transcripts with the minus exon 22 isoform following compound treatment. In each case, the data represent separate measurements produced for three biological replicates. Statistical analysis demonstrates the significance of compound treatments on both INSR and ATP2A1 splicing profiles towards that of the non-DM form.

